Difference between revisions of "Fourier Transform"
Jump to navigation
Jump to search
| Line 4: | Line 4: | ||
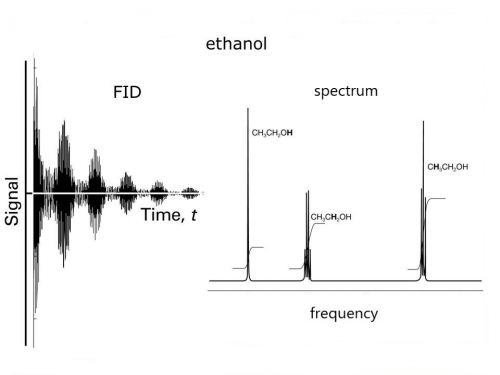
[[File:ethanol_fid_and_spectrum_modified.jpg|500px]] | [[File:ethanol_fid_and_spectrum_modified.jpg|500px]] | ||
| − | |||
| − | |||
Revision as of 09:53, 15 April 2021
Fourier Transform does mathematically what our ears do physically: resolve a signal into component frequencies. FT is a method to determine the simple wave components of a mixed wave. The method is theoretically based on calculus, but is actually carried out computationally using numerical analysis.
The signal output from an NMR instrument is called a Free Induction Decay (FID) and looks like the image on the left, which is intensity of the signal versus time. A fourier transform algorithm is applied to the signal which converts it to intensity versus frequency and looks like the image on the right:
